
ファイル:Decline curve analysis software image of exponential decline - hyperbolic decline.jpg

元のファイル (1,408 × 1,050 ピクセル、ファイルサイズ: 665キロバイト、MIME タイプ: image/jpeg)
ウィキメディア・コモンズのファイルページにある説明を、以下に表示します。
|
概要
| 解説 |
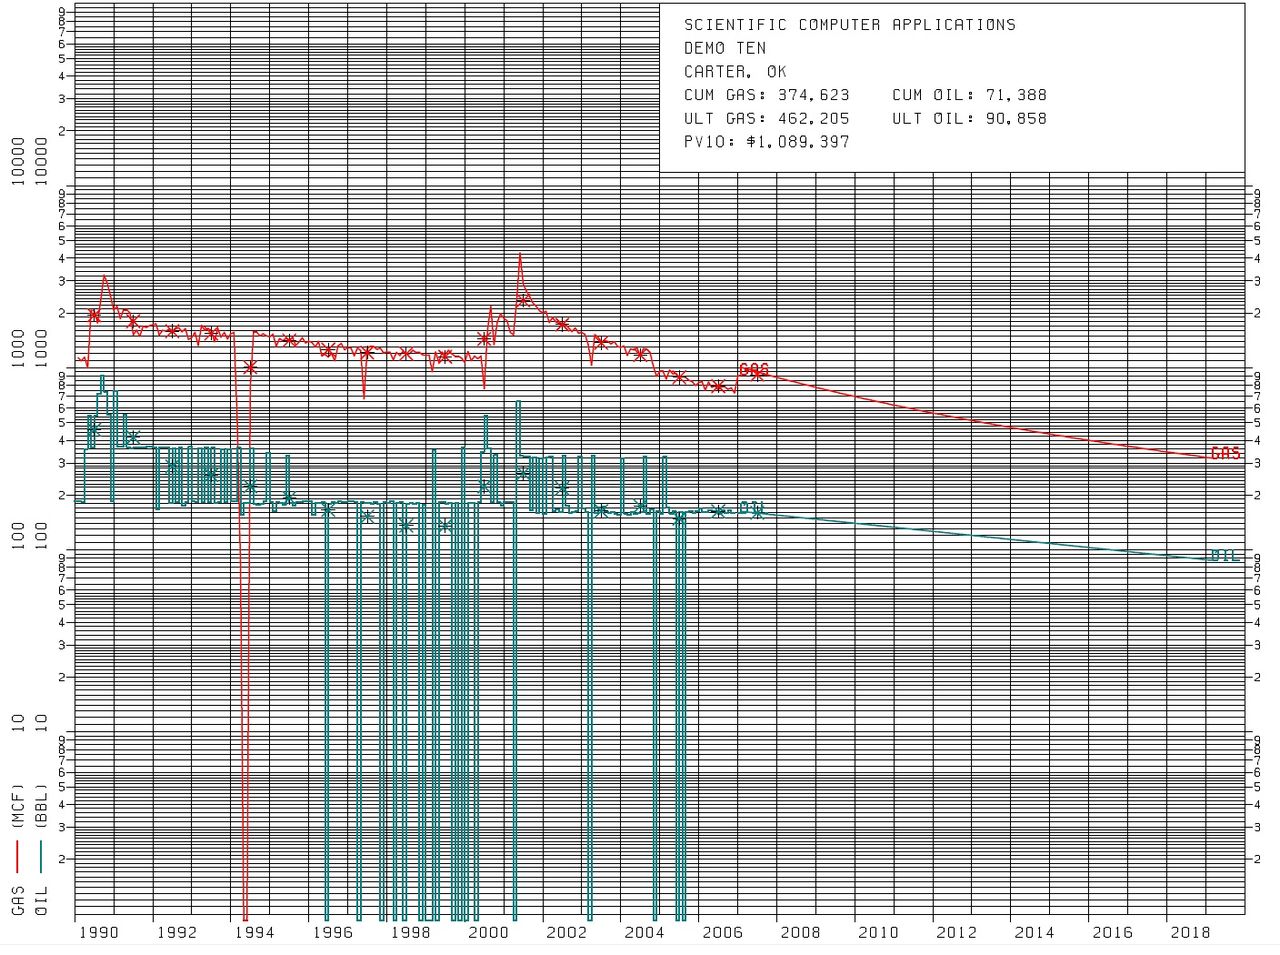
English: Decline curve generated by decline curve analysis software, utilized in oil economics and petroleum economics to indicate the depletion of oil & gas in a Petroleum reservoir.
The Y axis is a semi log scale, indicating the rate of Oil depletion (green line), and gas depletion (red line). The X axis is a coordinate scale, indicating time in years and displays the production decline curve. The top red line is the gas decline curve, which is a hyperbolic decline curve. Gas is measured in MCF (Thousand cubic feet). The lower Blue line is the oil decline curve, which is an exponential decline curve. Oil is measured in BBL, or Oil barrels. Data is from actual sales, not pumped production. The dips to zero indicate there were no sales that month, likely because the Oil well did not produce a full tank, and thus was not worth a visit from a Tank truck. The upper right Legend (map) displays CUM, which is the cumulative gas or oil produced. ULT is the ultimate recovery projected for the well. Pv10 is the Discounted present value of 10%, which is the Future value of the remaining lease, valued for this oil well at $1.089 M USD. |
||
| 日付 | |||
| 原典 | Sent to me personally | ||
| 作者 | Richard Banks | ||
| 許可 (ファイルの再利用) |
|

- Other information
ライセンス

|
このファイルの著作権者Richard Banksは、あらゆる人があらゆる目的でこのファイルを使用することを許可しています。ただし著作権者の名義が適切に表示されることを条件とします。再頒布、二次的著作物の製作、商用利用等のあらゆる使用が許可されています。 |
帰属:
Screenshot image generated by Forecasting, Economics and Graphics System (FEGS) decline curve analysis software. [1]
|
元のアップロードログ
en.wikipedia からコモンズに For the Common Good を用いて移動されました。
| 日付と時刻 | 寸法 | 利用者 | コメント |
|---|---|---|---|
| 05:08, 16 May 2012 | 1,408 × 1,050 (681,147 bytes) | w:en:RainmakerUSA (トーク | 投稿記録) | Decline curve generated by decline curve analysis software, utilized in [[oil economics]] and [[petroleum economics]] to indicate the depletion of oil & gas in a [[Petroleum reservoir]]. The Y axis is a semi log scale, indicating the rate of [[Oil de... |

|
この画像のカテゴリは再検討が必要です。今すぐ再検討する
|
ファイルの履歴
過去の版のファイルを表示するには、その版の日時をクリックしてください。
| 日付と時刻 | サムネイル | 寸法 | 利用者 | コメント | |
|---|---|---|---|---|---|
| 現在の版 | 2014年7月12日 (土) 00:04 | | 1,408 × 1,050 (665キロバイト) | Josve05a | Transferred from en.wikipedia: see original upload log above |
ファイルの使用状況
以下のページがこのファイルを使用しています:
グローバルなファイル使用状況
以下に挙げる他のウィキがこの画像を使っています:
- en.wikipedia.org での使用状況
- es.wikipedia.org での使用状況
- eu.wikipedia.org での使用状況
- fr.wikipedia.org での使用状況
- zh.wikipedia.org での使用状況